本案例是一个隐函数可视化的例子, 相信大家都学习过形如 f(x, y) = 0 的隐函数。
本案例支持绘制任意函数签名类似于 double func(double x, double y) 这样的函数体,
这个 func 的参数 x, y 被用于横纵坐标, 返回值表示这两个参数套用到这个函数里面时得到的值。
那么函数图像就很容易判断, 当 func(x, y) 的值接近 0 的时候, 就说明这个点在函数图像上了。
绘制的方法实际比较简单, 你可以遍历整张图像, 挨个计算并取值, 也可以进行采样绘制。
本案例提供的就是基于随机采样的绘制方式。
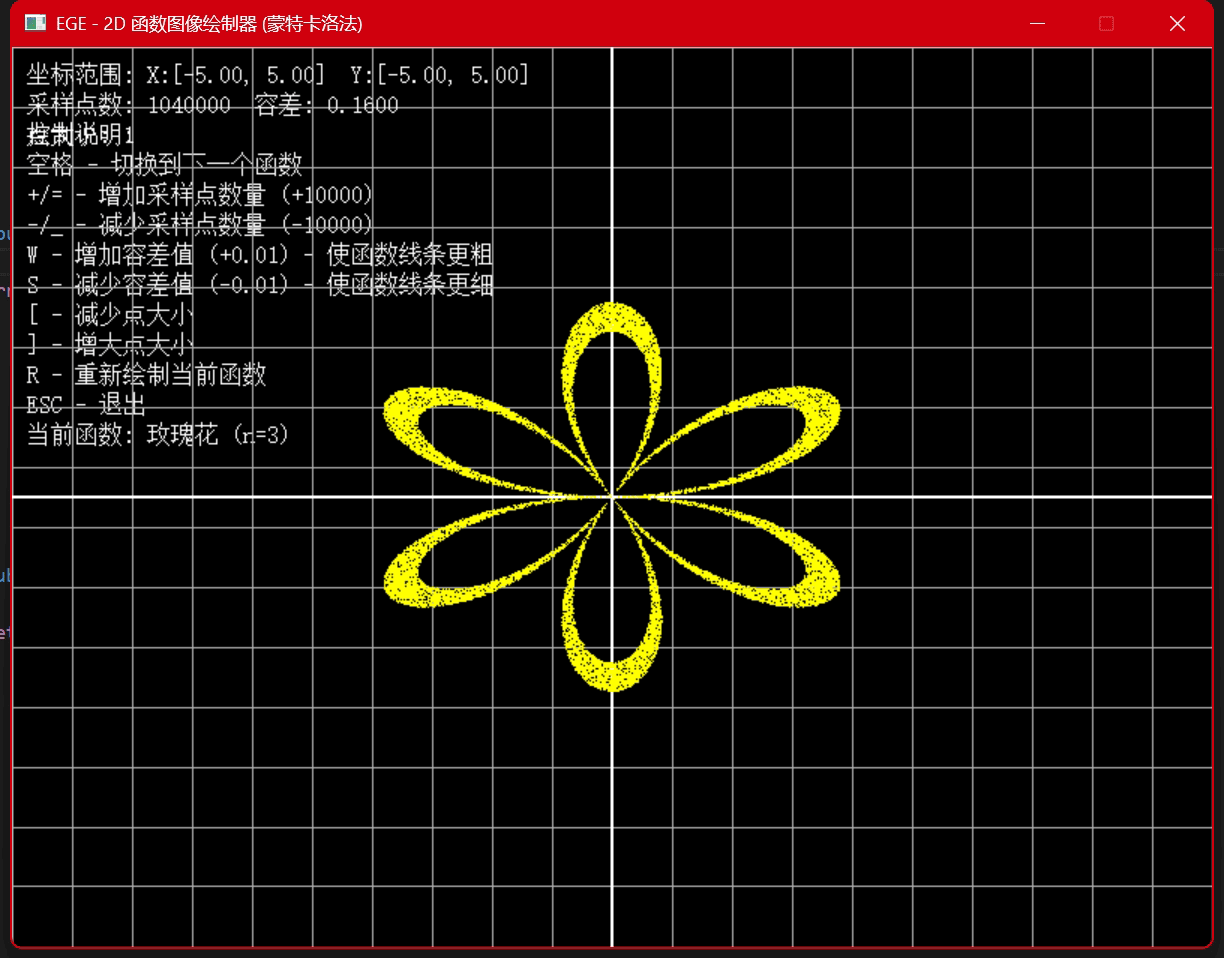
界面看图:
Github 连接: https://github.com/x-ege/xege/pull/285 (源码在本文章最下方, 滑到最下面查看)
简介
本项目基于蒙特卡洛方法实现了 2D 隐函数的可视化绘制。传统的函数绘制通常针对显式函数 y=f(x),而本项目支持绘制隐函数形式 f(x,y)=0,这使得可以轻松绘制圆、椭圆、心形等复杂图形。通过 EGE 图形库,程序提供了交互式的参数调整和多种预设函数演示。
本项目基于蒙特卡洛方法实现了 2D 隐函数的可视化绘制。传统的函数绘制通常针对显式函数 y = f(x),而本项目支持绘制隐函数形式 f(x, y) = 0,这使得可以轻松绘制圆、椭圆、心形等复杂图形。通过 EGE 图形库,程序提供了交互式的参数调整和多种预设函数演示。
蒙特卡洛方法原理
蒙特卡洛方法是一种基于随机采样的数值计算方法。在函数可视化中,其原理如下:
- 随机采样:在给定的坐标范围 [x_{min}, x_{max}] \times [y_{min}, y_{max}] 内随机生成大量点 (x, y)
- 函数评估:计算每个点的函数值 f(x, y)
- 条件筛选:如果 |f(x, y)| < \epsilon(其中 \epsilon 为容差),则认为该点在函数图像上
- 绘制点:将满足条件的点转换为屏幕坐标并绘制
优势:
- 不需要求解方程,适用于任意复杂的隐函数
- 实现简单,易于理解和扩展
- 能够处理多连通区域和不连续函数
参数影响:
- 采样点数:越多则图像越密集,但计算时间越长
- 容差 \epsilon:越小则曲线越细,但需要更多采样点
项目特性
- 多种预设函数:圆形、椭圆、抛物线、双曲线、正弦波、玫瑰花、心形、莲花
- 交互式调整:实时调整采样点数、容差、点大小
- 坐标系统:自动绘制网格和坐标轴
- 图像缓存:使用离屏绘制提升性能
- 参数显示:实时显示当前坐标范围和渲染参数
核心类设计
Function2DRenderer 类
|
1 2 3 4 5 6 7 8 9 10 11 12 13 14 15 16 |
class Function2DRenderer { public: using FunctionType = std::function<double(double, double)>; Function2DRenderer(int width, int height, double xMin, double xMax, double yMin, double yMax); void render(const FunctionType& func, PIMAGE pimg = NULL); void setTolerance(double tolerance); void setSampleCount(int count); private: void drawFunction(const FunctionType& func, PIMAGE pimg); void mathToScreen(double x, double y, int& screenX, int& screenY); }; |
核心成员:
m_xMin, m_xMax, m_yMin, m_yMax:数学坐标范围m_tolerance:函数值容差 \epsilonm_sampleCount:蒙特卡洛采样点数m_generator:随机数生成器m_xDistribution, m_yDistribution:均匀分布生成器
坐标系统转换
数学坐标到屏幕坐标的转换是可视化的关键:
|
1 2 3 4 |
void mathToScreen(double x, double y, int& screenX, int& screenY) const { screenX = static_cast<int>((x - m_xMin) / (m_xMax - m_xMin) * m_width); screenY = static_cast<int>((m_yMax - y) / (m_yMax - m_yMin) * m_height); } |
转换公式:
- 屏幕 X 坐标:screenX = \frac{x - x_{min}}{x_{max} - x_{min}} \times width
- 屏幕 Y 坐标:screenY = \frac{y_{max} - y}{y_{max} - y_{min}} \times height
注意 Y 坐标需要翻转,因为数学坐标系向上为正,而屏幕坐标系向下为正。
蒙特卡洛绘制实现
|
1 2 3 4 5 6 7 8 9 10 11 12 13 14 15 16 17 18 19 20 21 22 23 24 25 26 27 28 |
void drawFunction(const FunctionType& func, PIMAGE pimg) { setcolor(m_pointColor, pimg); setfillcolor(m_pointColor, pimg); for (int i = 0; i < m_sampleCount; ++i) { // 生成随机点 double x = m_xDistribution(m_generator); double y = m_yDistribution(m_generator); // 计算函数值 double value = func(x, y); // 如果函数值在容差范围内,绘制该点 if (std::abs(value) < m_tolerance) { int screenX, screenY; mathToScreen(x, y, screenX, screenY); if (screenX >= 0 && screenX < m_width && screenY >= 0 && screenY < m_height) { if (m_pointSize == 1) { putpixel(screenX, screenY, m_pointColor, pimg); } else { fillcircle(screenX, screenY, m_pointSize, pimg); } } } } } |
算法流程:
- 使用均匀分布生成随机坐标 (x, y)
- 计算 f(x, y) 的值
- 判断 |f(x, y)| < \epsilon
- 转换为屏幕坐标并绘制
预设函数实现
1. 圆形函数
|
1 2 3 4 5 |
Function2DRenderer::FunctionType circle(double radius) { return [radius](double x, double y) -> double { return x * x + y * y - radius * radius; }; } |
数学表达式:x^2 + y^2 - r^2 = 0
当 x^2 + y^2 = r^2 时,点 (x, y) 在半径为 r 的圆上。
2. 椭圆函数
|
1 2 3 4 5 |
Function2DRenderer::FunctionType ellipse(double a, double b) { return [a, b](double x, double y) -> double { return (x * x) / (a * a) + (y * y) / (b * b) - 1.0; }; } |
数学表达式:\frac{x^2}{a^2} + \frac{y^2}{b^2} - 1 = 0
标准椭圆方程,a 为 X 轴半径,b 为 Y 轴半径。
3. 抛物线函数
|
1 2 3 4 5 |
Function2DRenderer::FunctionType parabola(double a, double b, double c) { return [a, b, c](double x, double y) -> double { return y - a * x * x - b * x - c; }; } |
数学表达式:y - ax^2 - bx - c = 0
即 y = ax^2 + bx + c,标准二次函数。
4. 双曲线函数
|
1 2 3 4 5 |
Function2DRenderer::FunctionType hyperbola(double a, double b) { return [a, b](double x, double y) -> double { return (x * x) / (a * a) - (y * y) / (b * b) - 1.0; }; } |
数学表达式:\frac{x^2}{a^2} - \frac{y^2}{b^2} - 1 = 0
双曲线有两支,分别位于坐标轴两侧。
5. 正弦波函数
|
1 2 3 4 5 |
Function2DRenderer::FunctionType sineWave(double A, double B, double C) { return [A, B, C](double x, double y) -> double { return y - A * std::sin(B * x + C); }; } |
数学表达式:y - A \sin(Bx + C) = 0
- A:振幅
- B:频率
- C:相位偏移
6. 玫瑰花函数
|
1 2 3 4 5 6 7 8 9 10 |
Function2DRenderer::FunctionType rose(double A, int n) { return [A, n](double x, double y) -> double { double r = std::sqrt(x * x + y * y); if (r < 1e-10) return 0.0; double theta = std::atan2(y, x); double expected_r = A * std::sin(n * theta); return std::abs(r - std::abs(expected_r)); }; } |
极坐标表达式:r = A \sin(n\theta)
转换为直角坐标需要:
- r = \sqrt{x^2 + y^2}
- \theta = \arctan(\frac{y}{x})
当 n = 3 时,产生三瓣玫瑰花形状。
7. 心形函数
|
1 2 3 4 5 6 |
Function2DRenderer::FunctionType heart() { return [](double x, double y) -> double { double temp = x * x + y * y - 1.0; return temp * temp * temp - x * x * y * y * y; }; } |
数学表达式:(x^2 + y^2 - 1)^3 - x^2 y^3 = 0
这是一个经典的心形曲线方程。
8. 莲花函数
|
1 2 3 4 5 6 7 |
Function2DRenderer::FunctionType lotus() { return [](double x, double y) -> double { double r = std::sqrt(x * x + y * y); double theta = std::atan2(y, x); return r - 0.5 * (1 + std::sin(4 * theta)); }; } |
极坐标表达式:r = 0.5(1 + \sin(4\theta))
产生四瓣花瓣的莲花形状。
EGE 图形库应用
1. 网格绘制
|
1 2 3 4 5 6 7 8 9 10 11 12 13 14 15 16 17 |
void drawGrid(PIMAGE pimg) { setcolor(m_gridColor, pimg); setlinewidth(1, pimg); double xStep = (m_xMax - m_xMin) / 20.0; double yStep = (m_yMax - m_yMin) / 15.0; // 绘制垂直线 for (double x = m_xMin; x <= m_xMax; x += xStep) { int screenX1, screenY1, screenX2, screenY2; mathToScreen(x, m_yMin, screenX1, screenY1); mathToScreen(x, m_yMax, screenX2, screenY2); line(screenX1, screenY1, screenX2, screenY2, pimg); } // 绘制水平线(类似实现) } |
2. 坐标轴绘制
|
1 2 3 4 5 6 7 8 9 10 11 12 13 14 |
void drawAxes(PIMAGE pimg) { setcolor(m_axisColor, pimg); setlinewidth(2, pimg); // 绘制 X 轴(如果 Y=0 在范围内) if (m_yMin <= 0 && m_yMax >= 0) { int screenX1, screenY1, screenX2, screenY2; mathToScreen(m_xMin, 0, screenX1, screenY1); mathToScreen(m_xMax, 0, screenX2, screenY2); line(screenX1, screenY1, screenX2, screenY2, pimg); } // 绘制 Y 轴(类似实现) } |
3. 离屏渲染
|
1 2 3 4 5 6 7 8 |
PIMAGE imgCache = newimage(800, 600); // 渲染到缓存图像 renderer.renderFunction(functionNames[currentFunction], imgCache); // 显示到屏幕 cleardevice(); putimage(0, 0, imgCache); |
使用 PIMAGE 实现双缓冲,避免闪烁。
4. 随机数生成
|
1 2 3 4 5 6 7 |
std::mt19937 m_generator; std::uniform_real_distribution<double> m_xDistribution(m_xMin, m_xMax); std::uniform_real_distribution<double> m_yDistribution(m_yMin, m_yMax); // 生成随机点 double x = m_xDistribution(m_generator); double y = m_yDistribution(m_generator); |
使用 C++11 的随机数库生成均匀分布的随机坐标。
交互操作
- 空格:切换到下一个预设函数
- + / =:增加采样点数(+10000)
- – / _:减少采样点数(-10000)
- W:增加容差(+0.01),使曲线更粗
- S:减少容差(-0.01),使曲线更细
- [:减小点大小
- ]:增大点大小
- R:重新绘制当前函数
- ESC:退出程序
性能优化
- 图像缓存:将结果绘制到离屏图像,避免重复计算
- 边界检查:只绘制屏幕范围内的点
- 容差控制:通过调整容差平衡图像质量和采样点数
- 随机数优化:使用高效的 Mersenne Twister 随机数生成器
扩展方向
基于这个框架,可以轻松扩展:
- 3D 函数可视化:扩展为 f(x, y, z) = 0 的三维绘制
- 参数方程绘制:支持参数方程 (x(t), y(t)) 的绘制
- 动画效果:通过参数动态变化实现动画
- 颜色映射:根据函数值 |f(x, y)| 映射不同颜色
- 交互式编辑:允许用户输入自定义函数表达式
数学与编程结合
这个项目很好地展示了数学与编程的结合:
- 隐函数理论:理解 f(x, y) = 0 的几何意义
- 概率方法:蒙特卡洛方法的实际应用
- 坐标变换:数学坐标系与屏幕坐标系的转换
- 函数式编程:使用
std::function和 Lambda 表达式 - C++ 现代特性:随机数库、智能指针、模板等
通过本项目,你不仅能学习图形编程和可视化技术,还能加深对隐函数、极坐标方程等数学概念的理解,是数学建模和计算机图形学学习的优秀案例。
源码就一个文件, 在配置了 EGE 的情况下可以直接复制并运行:
|
1 2 3 4 5 6 7 8 9 10 11 12 13 14 15 16 17 18 19 20 21 22 23 24 25 26 27 28 29 30 31 32 33 34 35 36 37 38 39 40 41 42 43 44 45 46 47 48 49 50 51 52 53 54 55 56 57 58 59 60 61 62 63 64 65 66 67 68 69 70 71 72 73 74 75 76 77 78 79 80 81 82 83 84 85 86 87 88 89 90 91 92 93 94 95 96 97 98 99 100 101 102 103 104 105 106 107 108 109 110 111 112 113 114 115 116 117 118 119 120 121 122 123 124 125 126 127 128 129 130 131 132 133 134 135 136 137 138 139 140 141 142 143 144 145 146 147 148 149 150 151 152 153 154 155 156 157 158 159 160 161 162 163 164 165 166 167 168 169 170 171 172 173 174 175 176 177 178 179 180 181 182 183 184 185 186 187 188 189 190 191 192 193 194 195 196 197 198 199 200 201 202 203 204 205 206 207 208 209 210 211 212 213 214 215 216 217 218 219 220 221 222 223 224 225 226 227 228 229 230 231 232 233 234 235 236 237 238 239 240 241 242 243 244 245 246 247 248 249 250 251 252 253 254 255 256 257 258 259 260 261 262 263 264 265 266 267 268 269 270 271 272 273 274 275 276 277 278 279 280 281 282 283 284 285 286 287 288 289 290 291 292 293 294 295 296 297 298 299 300 301 302 303 304 305 306 307 308 309 310 311 312 313 314 315 316 317 318 319 320 321 322 323 324 325 326 327 328 329 330 331 332 333 334 335 336 337 338 339 340 341 342 343 344 345 346 347 348 349 350 351 352 353 354 355 356 357 358 359 360 361 362 363 364 365 366 367 368 369 370 371 372 373 374 375 376 377 378 379 380 381 382 383 384 385 386 387 388 389 390 391 392 393 394 395 396 397 398 399 400 401 402 403 404 405 406 407 408 409 410 411 412 413 414 415 416 417 418 419 420 421 422 423 424 425 426 427 428 429 430 431 432 433 434 435 436 437 438 439 440 441 442 443 444 445 446 447 448 449 450 451 452 453 454 455 456 457 458 459 460 461 462 463 464 465 466 467 468 469 470 471 472 473 474 475 476 477 478 479 480 481 482 483 484 485 486 487 488 489 490 491 492 493 494 495 496 497 498 499 500 501 502 503 504 505 506 507 508 509 510 511 512 513 514 515 516 517 518 519 520 521 522 523 524 525 526 527 528 529 530 531 532 533 534 535 536 537 538 539 540 541 542 543 544 545 546 547 548 549 550 551 552 553 554 555 556 557 558 559 560 561 562 563 564 565 566 567 568 569 570 571 572 573 574 575 576 577 578 579 580 581 582 583 584 585 586 587 588 589 590 591 592 593 594 595 596 597 598 599 600 601 602 603 604 605 606 607 608 609 610 611 612 613 614 615 616 617 618 619 620 621 622 623 624 625 626 627 628 629 630 631 632 633 634 635 636 637 638 639 |
/** * @file graph_function_visualization.cpp * @author wysaid (this@xege.org) * @brief 基于蒙特卡洛法的 2D 函数图像绘制 * @version 0.1 * @date 2025-07-12 * */ #ifndef NOMINMAX #define NOMINMAX 1 #endif #include <graphics.h> #include <cmath> #include <functional> #include <random> #include <iostream> #include <string> #include <vector> #include <algorithm> #include <map> // 文本本地化宏定义 #ifdef _MSC_VER // MSVC编译器使用中文文案 #define TEXT_WINDOW_TITLE "EGE - 2D 函数图像绘制器 (蒙特卡洛法)" #define TEXT_CONTROLS_TITLE "控制说明:" #define TEXT_CONTROLS_SPACE "空格 - 切换到下一个函数" #define TEXT_CONTROLS_SAMPLES "+/= - 增加采样点数量 (+10000)" #define TEXT_CONTROLS_SAMPLES_DOWN "-/_ - 减少采样点数量 (-10000)" #define TEXT_CONTROLS_TOLERANCE_UP "W - 增加容差值 (+0.01) - 使函数线条更粗" #define TEXT_CONTROLS_TOLERANCE_DOWN "S - 减少容差值 (-0.01) - 使函数线条更细" #define TEXT_CONTROLS_POINT_SIZE_DOWN "[ - 减少点大小" #define TEXT_CONTROLS_POINT_SIZE_UP "] - 增大点大小" #define TEXT_CONTROLS_REDRAW "R - 重新绘制当前函数" #define TEXT_CONTROLS_EXIT "ESC - 退出" #define TEXT_CURRENT_FUNCTION "当前函数: %s" #define TEXT_COORD_RANGE "坐标范围: X:[%.2f, %.2f] Y:[%.2f, %.2f]" #define TEXT_PARAMS_INFO "采样点数: %d 容差: %.4f" #define TEXT_POINT_SIZE_INFO "点大小: %d" #define TEXT_FUNCTION_CIRCLE "圆形 (r=2)" #define TEXT_FUNCTION_ELLIPSE "椭圆 (a=3, b=2)" #define TEXT_FUNCTION_PARABOLA "抛物线 (y=x^2)" #define TEXT_FUNCTION_HYPERBOLA "双曲线" #define TEXT_FUNCTION_SINE "正弦波" #define TEXT_FUNCTION_ROSE "玫瑰花 (n=3)" #define TEXT_FUNCTION_HEART "心形" #define TEXT_FUNCTION_LOTUS "莲花" #define TEXT_FONT_NAME "宋体" #else // 非MSVC编译器使用英文文案 #define TEXT_WINDOW_TITLE "EGE - 2D Function Graph Renderer (Monte Carlo Method)" #define TEXT_CONTROLS_TITLE "Controls:" #define TEXT_CONTROLS_SPACE "SPACE - Next function" #define TEXT_CONTROLS_SAMPLES "+/= - Increase samples (+10000)" #define TEXT_CONTROLS_SAMPLES_DOWN "-/_ - Decrease samples (-10000)" #define TEXT_CONTROLS_TOLERANCE_UP "W - Increase tolerance (+0.01)" #define TEXT_CONTROLS_TOLERANCE_DOWN "S - Decrease tolerance (-0.01)" #define TEXT_CONTROLS_POINT_SIZE_DOWN "[ - Decrease point size" #define TEXT_CONTROLS_POINT_SIZE_UP "] - Increase point size" #define TEXT_CONTROLS_REDRAW "R - Redraw current function" #define TEXT_CONTROLS_EXIT "ESC - Exit" #define TEXT_CURRENT_FUNCTION "Current: %s" #define TEXT_COORD_RANGE "X: [%.2f, %.2f] Y: [%.2f, %.2f]" #define TEXT_PARAMS_INFO "Samples: %d Tolerance: %.4f" #define TEXT_POINT_SIZE_INFO "Point Size: %d" #define TEXT_FUNCTION_CIRCLE "Circle (r=2)" #define TEXT_FUNCTION_ELLIPSE "Ellipse (a=3, b=2)" #define TEXT_FUNCTION_PARABOLA "Parabola (y=x^2)" #define TEXT_FUNCTION_HYPERBOLA "Hyperbola" #define TEXT_FUNCTION_SINE "Sine Wave" #define TEXT_FUNCTION_ROSE "Rose (n=3)" #define TEXT_FUNCTION_HEART "Heart" #define TEXT_FUNCTION_LOTUS "Lotus" #define TEXT_FONT_NAME "Arial" #endif /** * @class Function2DRenderer * @brief 基于蒙特卡洛法的2D函数图像绘制类 * * 该类可以绘制形如 f(x,y) = 0 的函数图像,通过蒙特卡洛方法 * 在指定区域内随机采样点,计算函数值,当函数值接近0时绘制该点 */ class Function2DRenderer { public: /** * @brief 函数类型定义 * 函数应该返回 f(x,y) 的值,当返回值为0时表示该点在函数图像上 */ using FunctionType = std::function<double(double, double)>; /** * @brief 构造函数 * @param width 绘图区域宽度(像素) * @param height 绘图区域高度(像素) * @param xMin 数学坐标系X轴最小值 * @param xMax 数学坐标系X轴最大值 * @param yMin 数学坐标系Y轴最小值 * @param yMax 数学坐标系Y轴最大值 */ Function2DRenderer(int width, int height, double xMin, double xMax, double yMin, double yMax) : m_width(width), m_height(height), m_xMin(xMin), m_xMax(xMax), m_yMin(yMin), m_yMax(yMax), m_tolerance(0.01), m_sampleCount(100000), m_pointColor(RED), m_backgroundColor(BLACK), m_drawAxes(true), m_axisColor(WHITE), m_gridColor(DARKGRAY), m_showGrid(true), m_generator(std::random_device{}()), m_xDistribution(m_xMin, m_xMax), m_yDistribution(m_yMin, m_yMax) {} /** * @brief 设置函数容差 * @param tolerance 容差值,当 |f(x,y)| < tolerance 时认为点在函数图像上 */ void setTolerance(double tolerance) { m_tolerance = std::abs(tolerance); } double tolerance() const { return m_tolerance; } /** * @brief 设置采样点数量 * @param count 蒙特卡洛采样的点数量 */ void setSampleCount(int count) { m_sampleCount = std::max(1000, count); } int sampleCount() const { return m_sampleCount; } /** * @brief 设置绘图颜色 * @param pointColor 函数图像点的颜色 * @param backgroundColor 背景颜色 */ void setColors(color_t pointColor, color_t backgroundColor) { m_pointColor = pointColor; m_backgroundColor = backgroundColor; } /** * @brief 设置坐标轴颜色 * @param axisColor 坐标轴颜色 * @param gridColor 网格颜色 */ void setAxisColors(color_t axisColor, color_t gridColor) { m_axisColor = axisColor; m_gridColor = gridColor; } /** * @brief 设置是否绘制坐标轴 * @param drawAxes 是否绘制坐标轴 */ void setDrawAxes(bool drawAxes) { m_drawAxes = drawAxes; } /** * @brief 设置是否显示网格 * @param showGrid 是否显示网格 */ void setShowGrid(bool showGrid) { m_showGrid = showGrid; } /** * @brief 设置点大小 * @param size 点的大小(像素) */ void setPointSize(int size) { m_pointSize = std::max(1, std::min(20, size)); } int pointSize() const { return m_pointSize; } /** * @brief 绘制函数图像 * @param func 要绘制的函数 * @param pimg 目标图像,NULL表示绘制到当前窗口 */ void render(const FunctionType& func, PIMAGE pimg = NULL) { if (!func) { return; } // 绘制网格 if (m_showGrid) { drawGrid(pimg); } // 绘制坐标轴 if (m_drawAxes) { drawAxes(pimg); } // 蒙特卡洛采样绘制函数图像 drawFunction(func, pimg); // 绘制标签 drawLabels(pimg); } /** * @brief 添加预定义函数示例 * @param name 函数名称 * @param func 函数对象 */ void addFunction(const std::string& name, const FunctionType& func) { m_functions[name] = func; } /** * @brief 获取预定义函数列表 * @return 函数名称列表 */ std::vector<std::string> getFunctionNames() const { std::vector<std::string> names; for (const auto& pair : m_functions) { names.push_back(pair.first); } return names; } /** * @brief 绘制预定义函数 * @param name 函数名称 * @param pimg 目标图像 */ void renderFunction(const std::string& name, PIMAGE pimg) { auto it = m_functions.find(name); if (it != m_functions.end()) { render(it->second, pimg); } } private: /** * @brief 将数学坐标转换为屏幕坐标 * @param x 数学坐标x * @param y 数学坐标y * @param screenX 输出屏幕坐标x * @param screenY 输出屏幕坐标y */ void mathToScreen(double x, double y, int& screenX, int& screenY) const { screenX = static_cast<int>((x - m_xMin) / (m_xMax - m_xMin) * m_width); screenY = static_cast<int>((m_yMax - y) / (m_yMax - m_yMin) * m_height); } /** * @brief 绘制坐标轴 * @param pimg 目标图像 */ void drawAxes(PIMAGE pimg) { setcolor(m_axisColor, pimg); setlinewidth(2, pimg); // 绘制X轴 if (m_yMin <= 0 && m_yMax >= 0) { int screenX1, screenY1, screenX2, screenY2; mathToScreen(m_xMin, 0, screenX1, screenY1); mathToScreen(m_xMax, 0, screenX2, screenY2); line(screenX1, screenY1, screenX2, screenY2, pimg); } // 绘制Y轴 if (m_xMin <= 0 && m_xMax >= 0) { int screenX1, screenY1, screenX2, screenY2; mathToScreen(0, m_yMin, screenX1, screenY1); mathToScreen(0, m_yMax, screenX2, screenY2); line(screenX1, screenY1, screenX2, screenY2, pimg); } } /** * @brief 绘制网格 * @param pimg 目标图像 */ void drawGrid(PIMAGE pimg) { setcolor(m_gridColor, pimg); setlinewidth(1, pimg); // 计算网格间隔 double xStep = (m_xMax - m_xMin) / 20.0; double yStep = (m_yMax - m_yMin) / 15.0; // 绘制垂直网格线 for (double x = m_xMin; x <= m_xMax; x += xStep) { int screenX1, screenY1, screenX2, screenY2; mathToScreen(x, m_yMin, screenX1, screenY1); mathToScreen(x, m_yMax, screenX2, screenY2); line(screenX1, screenY1, screenX2, screenY2, pimg); } // 绘制水平网格线 for (double y = m_yMin; y <= m_yMax; y += yStep) { int screenX1, screenY1, screenX2, screenY2; mathToScreen(m_xMin, y, screenX1, screenY1); mathToScreen(m_xMax, y, screenX2, screenY2); line(screenX1, screenY1, screenX2, screenY2, pimg); } } /** * @brief 使用蒙特卡洛法绘制函数图像 * @param func 要绘制的函数 * @param pimg 目标图像 */ void drawFunction(const FunctionType& func, PIMAGE pimg) { setcolor(m_pointColor, pimg); setfillcolor(m_pointColor, pimg); for (int i = 0; i < m_sampleCount; ++i) { // 生成随机点 double x = m_xDistribution(m_generator); double y = m_yDistribution(m_generator); // 计算函数值 double value = func(x, y); // 如果函数值在容差范围内,绘制该点 if (std::abs(value) < m_tolerance) { int screenX, screenY; mathToScreen(x, y, screenX, screenY); // 检查是否在屏幕范围内 if (screenX >= 0 && screenX < m_width && screenY >= 0 && screenY < m_height) { if (m_pointSize == 1) { putpixel(screenX, screenY, m_pointColor, pimg); } else { // 绘制圆形点 fillcircle(screenX, screenY, m_pointSize, pimg); } } } } } /** * @brief 绘制标签和坐标 * @param pimg 目标图像 */ void drawLabels(PIMAGE pimg) { setcolor(m_axisColor, pimg); setbkmode(TRANSPARENT, pimg); // 绘制坐标范围信息 if (pimg) { // 如果指定了目标图像,需要临时设置为当前目标 PIMAGE oldTarget = gettarget(); settarget(pimg); xyprintf(10, 10, TEXT_COORD_RANGE, m_xMin, m_xMax, m_yMin, m_yMax); xyprintf(10, 30, TEXT_PARAMS_INFO, m_sampleCount, m_tolerance); xyprintf(10, 50, TEXT_POINT_SIZE_INFO, m_pointSize); settarget(oldTarget); } else { // 直接输出到当前窗口 xyprintf(10, 10, TEXT_COORD_RANGE, m_xMin, m_xMax, m_yMin, m_yMax); xyprintf(10, 30, TEXT_PARAMS_INFO, m_sampleCount, m_tolerance); xyprintf(10, 50, TEXT_POINT_SIZE_INFO, m_pointSize); } } private: int m_width, m_height; // 绘图区域尺寸 double m_xMin, m_xMax; // X轴数学坐标范围 double m_yMin, m_yMax; // Y轴数学坐标范围 double m_tolerance; // 函数值容差 int m_sampleCount; // 蒙特卡洛采样点数 color_t m_pointColor; // 函数点颜色 color_t m_backgroundColor; // 背景颜色 color_t m_axisColor; // 坐标轴颜色 color_t m_gridColor; // 网格颜色 bool m_drawAxes; // 是否绘制坐标轴 bool m_showGrid; // 是否显示网格 int m_pointSize = 3; // 点大小 // 随机数生成器 mutable std::mt19937 m_generator; mutable std::uniform_real_distribution<double> m_xDistribution; mutable std::uniform_real_distribution<double> m_yDistribution; // 预定义函数集合 std::map<std::string, FunctionType> m_functions; }; // 示例函数定义 namespace Examples { /** * @brief 圆形函数: x^2 + y^2 - r^2 = 0 * @param radius 圆的半径 * @return 圆形函数 */ Function2DRenderer::FunctionType circle(double radius) { return [radius](double x, double y) -> double { return x * x + y * y - radius * radius; }; } /** * @brief 椭圆函数: (x/a)^2 + (y/b)^2 - 1 = 0 * @param a 椭圆x轴半径 * @param b 椭圆y轴半径 * @return 椭圆函数 */ Function2DRenderer::FunctionType ellipse(double a, double b) { return [a, b](double x, double y) -> double { return (x * x) / (a * a) + (y * y) / (b * b) - 1.0; }; } /** * @brief 抛物线函数: y - ax^2 - bx - c = 0 * @param a 二次项系数 * @param b 一次项系数 * @param c 常数项 * @return 抛物线函数 */ Function2DRenderer::FunctionType parabola(double a, double b, double c) { return [a, b, c](double x, double y) -> double { return y - a * x * x - b * x - c; }; } /** * @brief 双曲线函数: (x/a)^2 - (y/b)^2 - 1 = 0 * @param a x轴参数 * @param b y轴参数 * @return 双曲线函数 */ Function2DRenderer::FunctionType hyperbola(double a, double b) { return [a, b](double x, double y) -> double { return (x * x) / (a * a) - (y * y) / (b * b) - 1.0; }; } /** * @brief 正弦波函数: y - A*sin(B*x + C) = 0 * @param A 振幅 * @param B 频率 * @param C 相位 * @return 正弦波函数 */ Function2DRenderer::FunctionType sineWave(double A, double B, double C) { return [A, B, C](double x, double y) -> double { return y - A * std::sin(B * x + C); }; } /** * @brief 花瓣函数: r = A*sin(n*θ), 转换为直角坐标 * @param A 振幅 * @param n 花瓣数量参数 * @return 花瓣函数 */ Function2DRenderer::FunctionType rose(double A, int n) { return [A, n](double x, double y) -> double { double r = std::sqrt(x * x + y * y); if (r < 1e-10) { return 0.0; } double theta = std::atan2(y, x); double expected_r = A * std::sin(n * theta); return std::abs(r - std::abs(expected_r)); }; } /** * @brief 心形函数: (x^2 + y^2 - 1)^3 - x^2*y^3 = 0 * @return 心形函数 */ Function2DRenderer::FunctionType heart() { return [](double x, double y) -> double { double temp = x * x + y * y - 1.0; return temp * temp * temp - x * x * y * y * y; }; } /** * @brief 莲花函数: x^2 + y^2 - sin(4*atan2(y,x)) = 0 * @return 莲花函数 */ Function2DRenderer::FunctionType lotus() { return [](double x, double y) -> double { double r = std::sqrt(x * x + y * y); double theta = std::atan2(y, x); return r - 0.5 * (1 + std::sin(4 * theta)); }; } } // namespace Examples // 演示程序 int main() { // 初始化图形界面 initgraph(800, 600, INIT_RENDERMANUAL); setbkcolor(BLACK); setbkmode(TRANSPARENT); setcaption(TEXT_WINDOW_TITLE); // 设置字体 settextjustify(LEFT_TEXT, TOP_TEXT); setfont(16, 0, TEXT_FONT_NAME); // 创建函数图像渲染器 Function2DRenderer renderer(800, 600, -5.0, 5.0, -5.0, 5.0); // 设置渲染参数 renderer.setTolerance(0.05); renderer.setSampleCount(200000); renderer.setColors(YELLOW, BLACK); renderer.setAxisColors(WHITE, DARKGRAY); renderer.setDrawAxes(true); renderer.setShowGrid(true); // 添加预定义函数 renderer.addFunction(TEXT_FUNCTION_CIRCLE, Examples::circle(2.0)); renderer.addFunction(TEXT_FUNCTION_ELLIPSE, Examples::ellipse(3.0, 2.0)); renderer.addFunction(TEXT_FUNCTION_PARABOLA, Examples::parabola(1.0, 0.0, 0.0)); renderer.addFunction(TEXT_FUNCTION_HYPERBOLA, Examples::hyperbola(2.0, 1.5)); renderer.addFunction(TEXT_FUNCTION_SINE, Examples::sineWave(2.0, 1.0, 0.0)); renderer.addFunction(TEXT_FUNCTION_ROSE, Examples::rose(2.0, 3)); renderer.addFunction(TEXT_FUNCTION_HEART, Examples::heart()); renderer.addFunction(TEXT_FUNCTION_LOTUS, Examples::lotus()); // 获取函数列表 auto functionNames = renderer.getFunctionNames(); int currentFunction = 0; PIMAGE imgCache = newimage(800, 600); // 渲染第一个函数 if (!functionNames.empty()) { renderer.renderFunction(functionNames[currentFunction], imgCache); } // 主循环 bool running = true; bool drawFunction = true; while (running) { // 检查键盘输入 while (kbhit()) { int key = getch(); switch (key) { case 27: // ESC键 - 退出程序 running = false; break; case '+': // 增加采样点数量 (+10000) case '=': renderer.setSampleCount(renderer.sampleCount() + 10000); drawFunction = true; break; case '-': // 减少采样点数量 (-10000) case '_': renderer.setSampleCount(std::max(1000, renderer.sampleCount() - 10000)); drawFunction = true; break; case 'w': // 增加容差值 (+0.01) - 使函数线条更粗 case 'W': renderer.setTolerance(std::min(1.0, renderer.tolerance() + 0.01)); drawFunction = true; break; case 's': // 减少容差值 (-0.01) - 使函数线条更细 case 'S': renderer.setTolerance(std::max(0.01, renderer.tolerance() - 0.01)); drawFunction = true; break; case '[': // 减少点大小 renderer.setPointSize(renderer.pointSize() - 1); drawFunction = true; break; case ']': // 增大点大小 renderer.setPointSize(renderer.pointSize() + 1); drawFunction = true; break; case 32: // 空格键 - 切换到下一个函数 if (!functionNames.empty()) { currentFunction = (currentFunction + 1) % functionNames.size(); drawFunction = true; } break; case 'r': // R键 - 重新绘制当前函数 case 'R': drawFunction = true; break; } } if (drawFunction && !functionNames.empty()) { settarget(imgCache); setbkcolor(BLACK); cleardevice(); // 清除屏幕 setcolor(WHITE); setbkmode(TRANSPARENT); outtextxy(10, 50, TEXT_CONTROLS_TITLE, NULL); outtextxy(10, 70, TEXT_CONTROLS_SPACE, NULL); outtextxy(10, 90, TEXT_CONTROLS_SAMPLES, NULL); outtextxy(10, 110, TEXT_CONTROLS_SAMPLES_DOWN, NULL); outtextxy(10, 130, TEXT_CONTROLS_TOLERANCE_UP, NULL); outtextxy(10, 150, TEXT_CONTROLS_TOLERANCE_DOWN, NULL); outtextxy(10, 170, TEXT_CONTROLS_POINT_SIZE_DOWN, NULL); outtextxy(10, 190, TEXT_CONTROLS_POINT_SIZE_UP, NULL); outtextxy(10, 210, TEXT_CONTROLS_REDRAW, NULL); outtextxy(10, 230, TEXT_CONTROLS_EXIT, NULL); // 显示当前函数名称 xyprintf(10, 250, TEXT_CURRENT_FUNCTION, functionNames[currentFunction].c_str()); renderer.renderFunction(functionNames[currentFunction], imgCache); settarget(nullptr); drawFunction = false; // 重置绘制标志 } cleardevice(); // 清除屏幕 putimage(0, 0, imgCache); // 绘制缓存图像 delay_fps(60); } // 清理资源 delimage(imgCache); closegraph(); return 0; } |
近期评论